Last year, I described my view on home energy consumption and my personal goals here: minimizing grid consumption.
Today, the summer of 2024 has passed and we’re moving into the “dark” season. It’s time to look ahead towards the end of the year, look back at my previous goals and adjust them where necessary.
Before we do that let’s have another look at my ambitious goals for the next years:
| Year | Grid consumption | Direct consumption |
| 2023 (today) | 80% | 20% |
| 2024 | 60% | 40% |
| 2025 | 53% | 47% |
| 2026 | 50% | 50% |
Status quo
At the end of 2023 roughly 20% of the energy we consumed was directly consumed from our solar panels. Today, in the beginning of October 2024, our direct consumption of the year 2024 (year-to-date) is 28.4%.
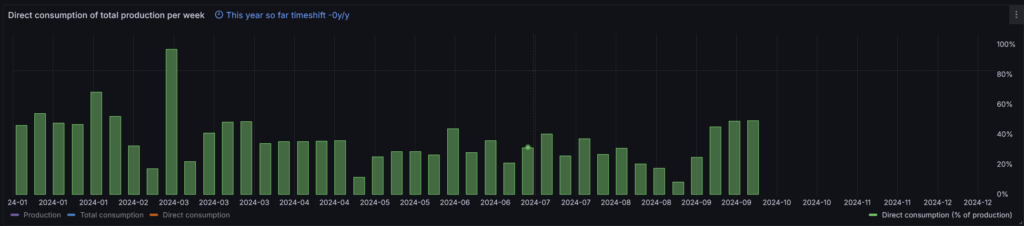
The start of the year seemed good. However, in the beginning of the year the solar panels deliver less energy compared to the summer months, so the direct consumption is higher in the “dark” months. In the end, I’m far away from the 40% I was hoping to achieve this year.
Changes
This was not totally unexpected, but still a bit of a disappointment. Especially considering the changes I’ve worked on during the year:
Introduction of a price index
I was already monitoring the epex-spot prices and predicting the production of solar energy. I used both data points to schedule energy consumption, but the algorithm was (too) complex to maintain and wasn’t always showing optimal results. I’ve created a price-index that combines the epex-price and expected solar production into a single value.
Energy planning using the price index
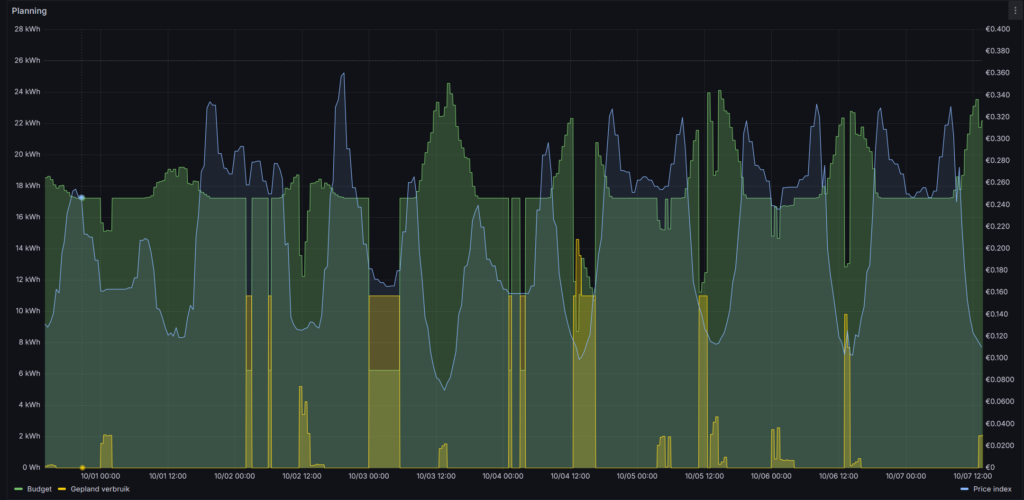
To use the price-index I needed to adjust the scheduling process. This was a difficult change because appliance specific micro services where doing their own planning. This meant I needed to change the “controllers” for the HomeConnect appliances, heatpump and car. I took this as an opportunity to create a separate scheduling micro service. The controllers now request the scheduling service for the best time to start a appliance specific program. The scheduler calculates the best start time based on the expect program duration, consumption and time to complete. The image below visualizes the result of the new scheduler process. Most programs are scheduled during the daily solar peak, when the price index is at it lowest point. However, when I get home from work at the end of the afternoon, and need to start driving early morning again, the scheduler uses the price index to chose the best time to charge the car during the night.
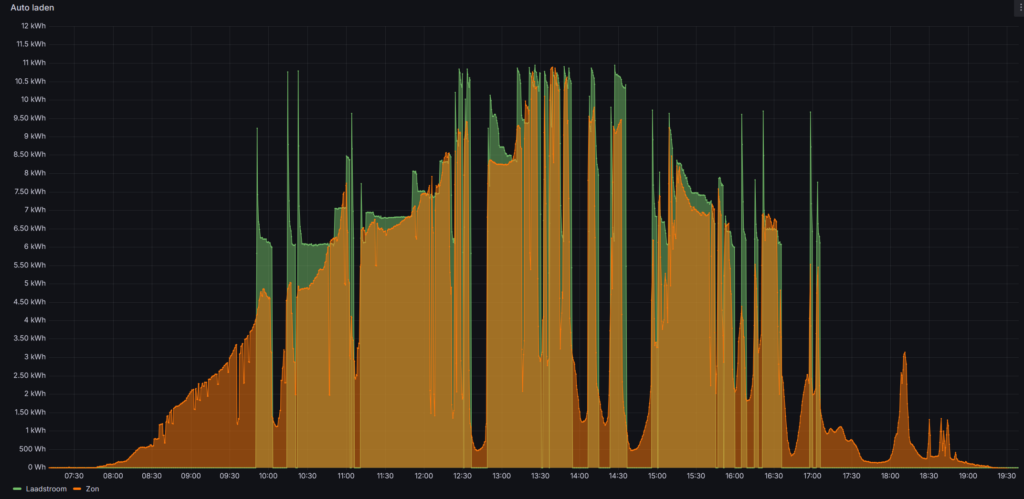
Unplanned car charging
When I don’t know when I need the car I just connect it to the socket. The controller then considers the actual solar production and redirects this energy to the car. To ensure a stable charging process I needed to build in some delays. The curve is not perfect, but I think it’s close enough.
There is some discussion on the impact of the power quality of “smart charging”. I need to understand this a bit better and probably need to adjust my algorithm.
What’s going on?
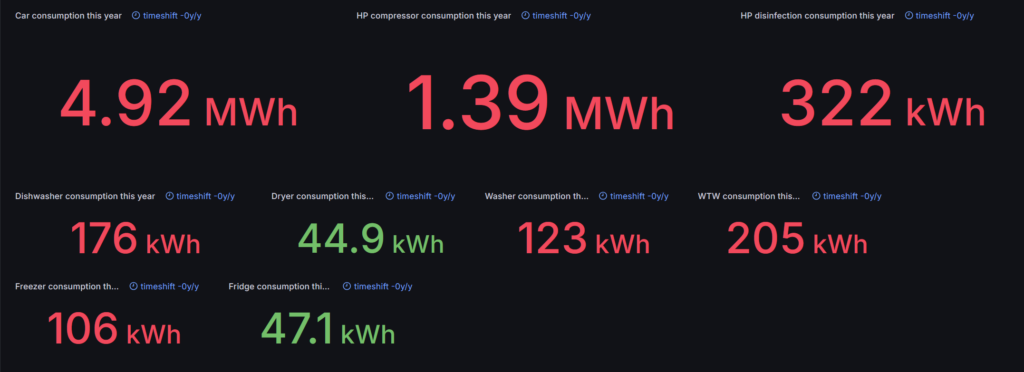
Why am I stuck at 28%? To answer this question I need to look at the two largest consumers: the car and the heatpump.
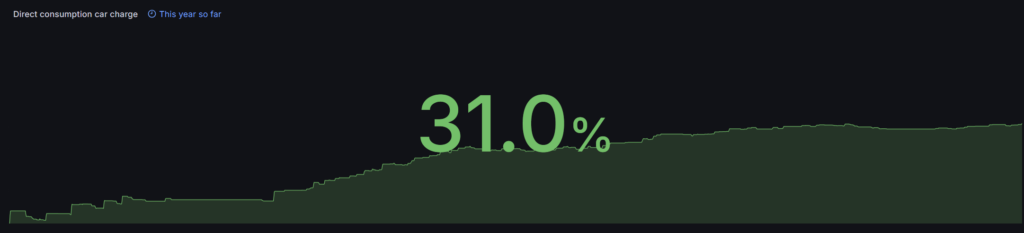
Car
Let’s start with the car: the direct consumption of the car is 31%. It will be very difficult to further improve this, as it’s depending on a combination of my work schedule and the weather. The situation has improved since the beginning of the year. I’m expecting the year end to be difficult as the solar production will go down in the last months of the year. I might be able to find small optimizations in the scheduler over the next months.
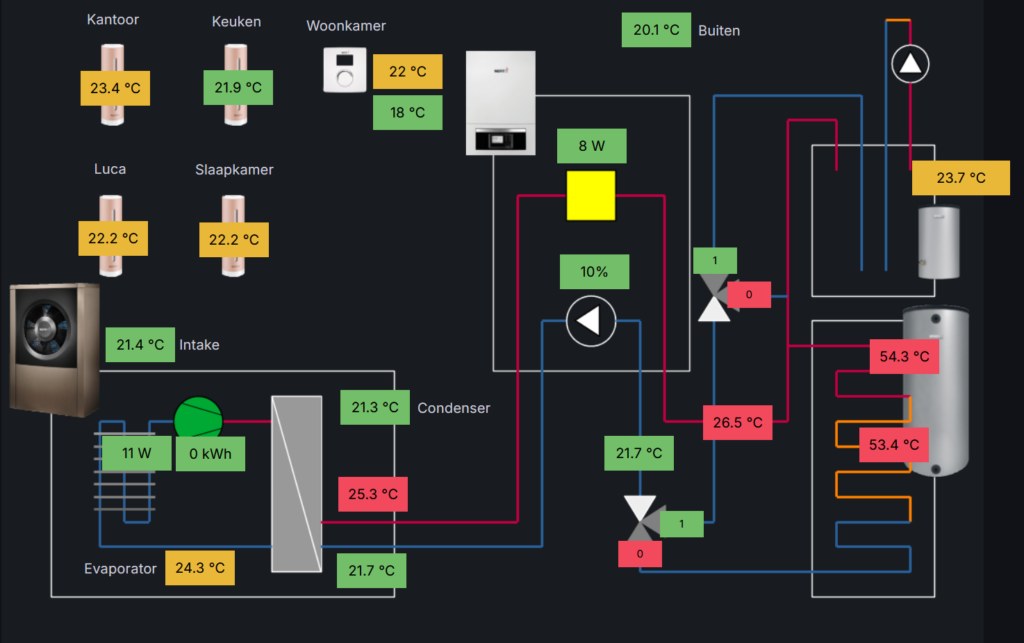
Heatpump
The heatpump is even more complex as it uses two energy sources (the compressor and the COP1 heater) and has three different goals: heating, cooling, and domestic hot water. For this analysis I have only looked at the difference between the compressor and the COP1 heater.
The digital twin of the heatpump was already operational at the end of 2023. It gives me full control of when domestic hot water, disinfection, heating and cooling are enabled.
I’ve started to work on a couple of things:
- Detailed planning of the generation of domestic hot water;
- Detailed planning of the disinfection process (to prevent bacteria);
- Reducing the operation hours of the heating and cooling process.
The domestic hot water is now only generated during the day, based on the price index. The scheduler does not wait until the hot water is “empty”, but starts generating hot water if it expects a sunny day to generate a buffer for the day after.
The disinfection is typically planned once a week. I needed to add a bit of slack and, depending on the predicted availability of solar energy, it now schedules the best time to run a disinfection run between 6-9 days after the last run. Additionally, the power of the disinfection is adjusted based on the maximum available solar energy. If a maximum of 3kW of solar energy is expected, the disinfection power is adjusted down from 9kW to 3kW, it’s lowest value. The disadvantage is that disinfection takes longer, but that has not proven to create new problems.
Last winter, the heatpump was running the entire night to heat the house. Then, on sunny days, the sun started heating up our living room through our glass “walls” resulting in an inside temperature of 25 degrees Celsius. The energy consumed by the heatpump in the night and morning was, more or less, wasted. The controller now looks at the predicted temperature and solar radiation of the upcoming day and only turns on the heatpump if a combination of a low temperature and low sun radiation is expected. Cooling is only enabled if the inside temperature reaches a configured threshold. This mechanism should prevent wasted energy, but is not optimized for generating heat a the best time of day.
This has resulted in 20% direct consumption, which is far from the target.
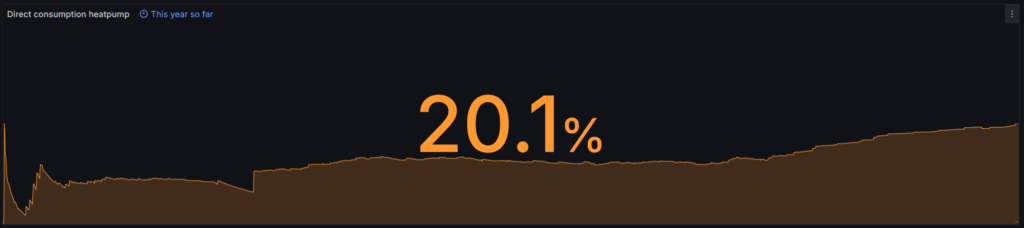
The largest problem is the heating in the winter. There is no solar energy produced so the direct consumption is low.
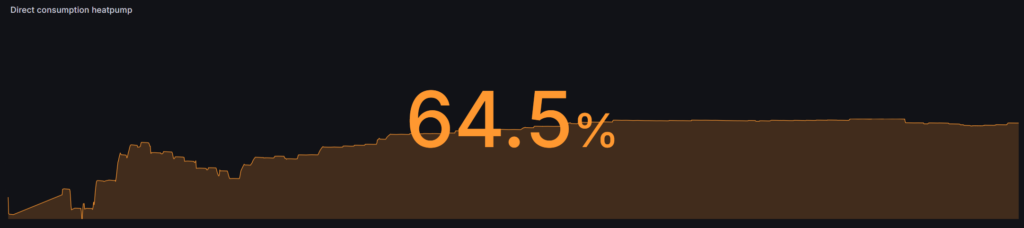
When I only look at the direct consumption over the last 90 days (7 Juli – 7 October) the situation looks a lot better.
Conclusion
I don’t think the 40% direct consumption target is realistic for 2024. I probably need another year to come to 40%.
Over the next months I need to start understanding in which situations the heatpump is consuming energy from the grid. Additionally, I will slowly start looking into the consumption and planning of the WTW (ventilation) unit, fridge, and freezer. At the same time I need to prevent the risk of food poisoning by (control) software failure.